GoTopeka
Project overview
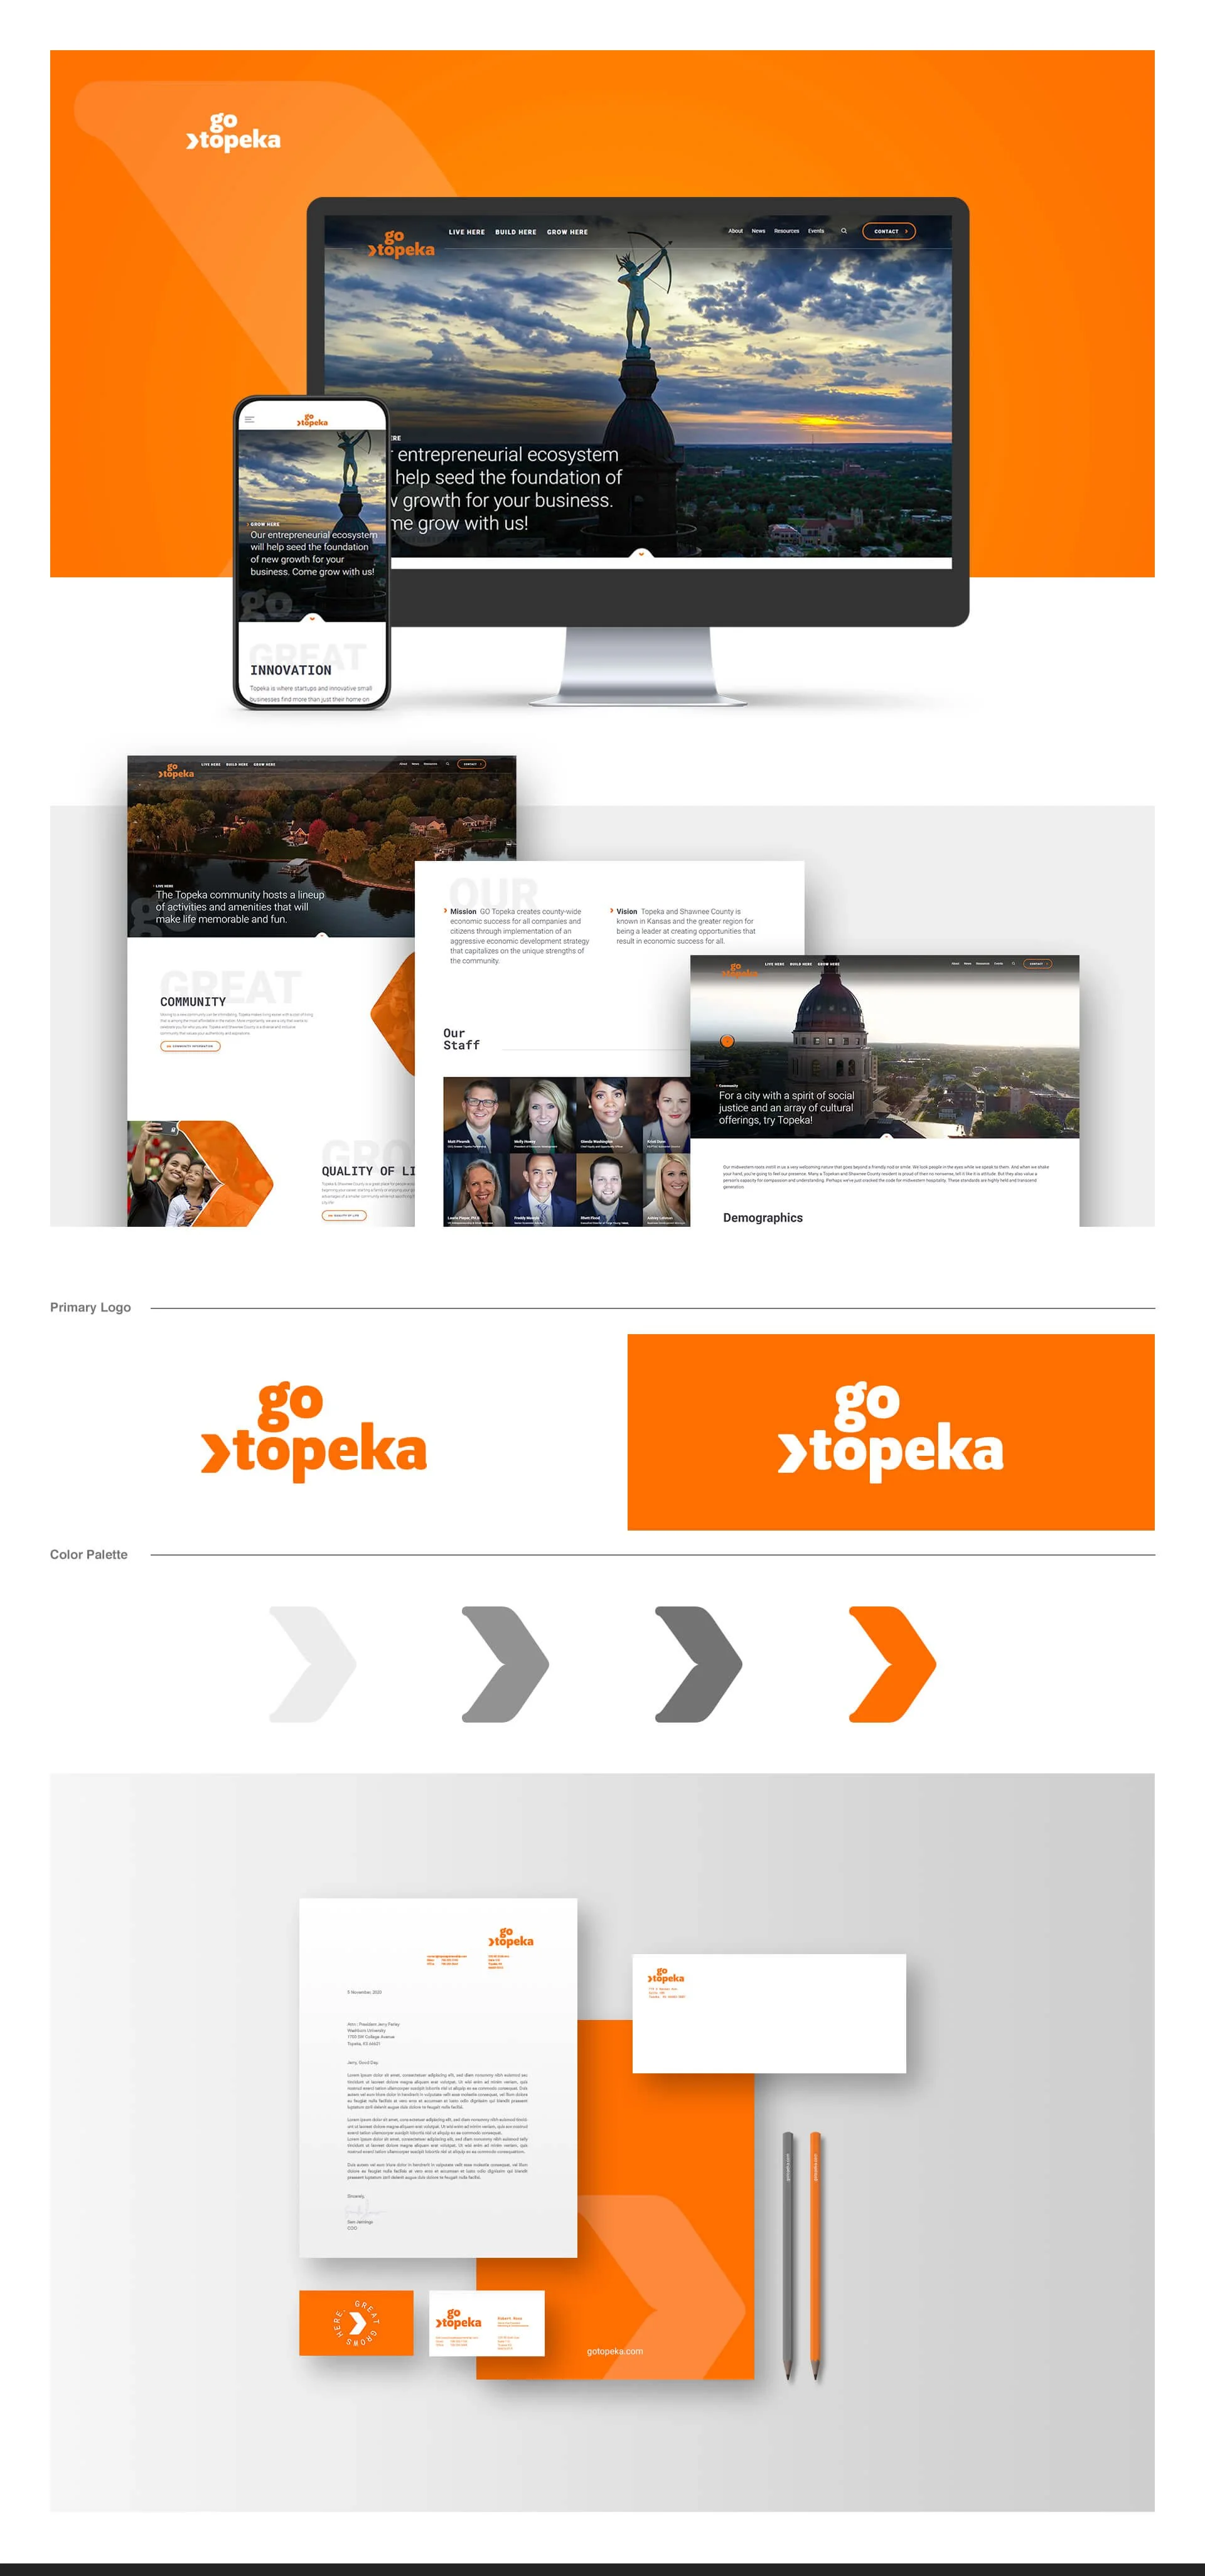
Project: GoTopeka initiative website — a civic platform to attract residents, workers, and businesses to Topeka/Shawnee County
Role: Senior UX Designer — led research, information architecture, UX writing, prototyping, usability testing, and handoff to dev/marketing
Timeline: 10 weeks (discovery → research → prototype → test → launch)
Team: Economic Development Leads, Marketing/Comms, Content Strategist, Front‑end Dev, Data/Analytics, Local Business SMEs
Context Mission: leverage Topeka’s community strengths to foster county‑wide economic growth for businesses and residents. Vision: position Topeka & Shawnee County as regional leaders in creating opportunities that drive economic success for all. The web product needed to convert three main audiences — people (relocation), talent (jobs), and businesses (investment/expansion) — into measurable leads and engagement.
Problem
Fragmented messaging across municipal sites made it hard for outsiders to find a single, persuasive resource about living, working, and building in Topeka.
Multiple audiences with different needs (relocation, workforce, business attraction) lacked tailored paths and concrete next steps.
Existing content lacked local proof points, streamlined contact flows, and tools to evaluate opportunity (cost comparisons, incentives, talent pools).
Goals & success metrics
Increase qualified inquiries for business relocation/expansion by 30% in 6 months
Drive 5,000+ relocation interest submissions and 3,000+ talent signups in first year
Improve time-on-page for opportunity pages (target +40%) and reduce bounce for relocation pages (target −25%)
Provide a single source of truth for resources, incentives, contact paths, and local data
Approach
Stakeholder alignment
Workshops with MissionGO leadership, economic development officers, workforce partners, and local business reps to prioritize audience needs and required data (incentives, sites, workforce stats).
UX research
Mixed-method research: 18 stakeholder interviews (business, HR, residents), 8 contextual interviews with potential relocators, and a competitive audit of peer city attractor sites.
Card-sorting and tree-testing to validate IA for multiple audiences.
Synthesis & personas
Developed 4 primary personas: Business Investor, Recruiting Manager, Family Relocator, Young Professional — captured goals, friction, decision criteria.
Information architecture & tools
Designed audience-first IA with three primary paths (Live, Work, Build) plus data center for downloadable assets (demographics, incentives, site maps).
Built interactive tools: cost-of-living comparison, talent-pool snapshot by industry, and a simple site-selector map with filters (available land, building size, utility capacity).
Content strategy & trust anchors
Collected and created local proof: employer spotlights, success stories, case studies, economic metrics, permit/process guides, and incentive checklists.
Emphasized clear CTAs: “Request Relocation Packet,” “Schedule Site Visit,” “Post Job/Recruit Talent.”
Prototyping & testing
High-fidelity prototypes (desktop/mobile) tested with target users; measured task success for finding incentives, requesting outreach, and comparing costs.
Implementation & analytics
Defined analytics events and dashboards to track funnel (visitor → resource download → contact request → scheduled visit) and prioritized iterative sprints.
UX Research — methods & key findings
Methods: stakeholder interviews (18), contextual user interviews (8), card-sort/tree-test, moderated usability tests (12), analytics baseline review.
Key findings:
Decision drivers differ: businesses need site/incentive data and workforce metrics; relocators seek schools, housing, commute times, community vibe.
Users want concise, actionable packets (downloadable one‑pagers) and clear next steps (contact or schedule visit).
Interactive comparison tools greatly increase engagement and perceived value.
Trust anchors (local employer testimonials, economic metrics, step-by-step permitting guides) reduce friction for business inquiries.
Design solutions
Audience-first landing pages: Live / Work / Build hubs with tailored hero messaging, quick metrics, and action-oriented CTAs.
Data center: downloadable, print-ready relocation & investment packets, zip-code level demographic snapshots, and incentive calculators.
Interactive tools: cost-of-living compare, labor pool heatmaps, and a filterable site-selector map with contact quick-forms.
Simplified contact flows: short, progressive-contact forms with follow-up scheduling and auto-generated customized packet emails.
Content & storytelling: local success stories, employer spotlights, and “day-in-the-life” features to demonstrate community culture.
Governance: content update playbook and data sync process with economic development datasets to keep facts current.
Measured outcomes (targets / early results)
Business inquiries: +32% qualified leads within 6 months (pilot regions)
Relocation interest submissions: 5,400 in year one (target exceeded)
Talent signups / job alert subscriptions: 3,200 in year one
Engagement: +45% time-on-page for Live/Build hubs; relocation page bounce −28%
Resource downloads: 18% of visitors downloaded relocation/incentive packets
Conversion funnel: 2.6x increase in scheduled site visits from web leads vs baseline
Deliverables
Audience IA and high-fidelity prototypes (desktop & mobile)
Interactive tool specs (cost compare, site selector, labor snapshot)
Relocation & investment packet templates and downloadable assets
Persona pack and messaging matrix
Usability test report and prioritized fixes
Analytics event map and KPI dashboard for funnel tracking
Handoff package: component specs, CMS templates, and governance playbook
Learnings & impact
Audience-tailored funnels (Live/Work/Build) reduce confusion and improve conversion — distinct CTAs and tools are essential for each group.
Interactive, data-driven tools increase engagement and provide practical value that motivates contact.
Local storytelling and employer spotlights build credibility faster than abstract economic claims.
Maintaining fresh datasets and a simple governance process is critical to retain trust with business prospects.