Kaw Valley Greenhouse POS
Project overview
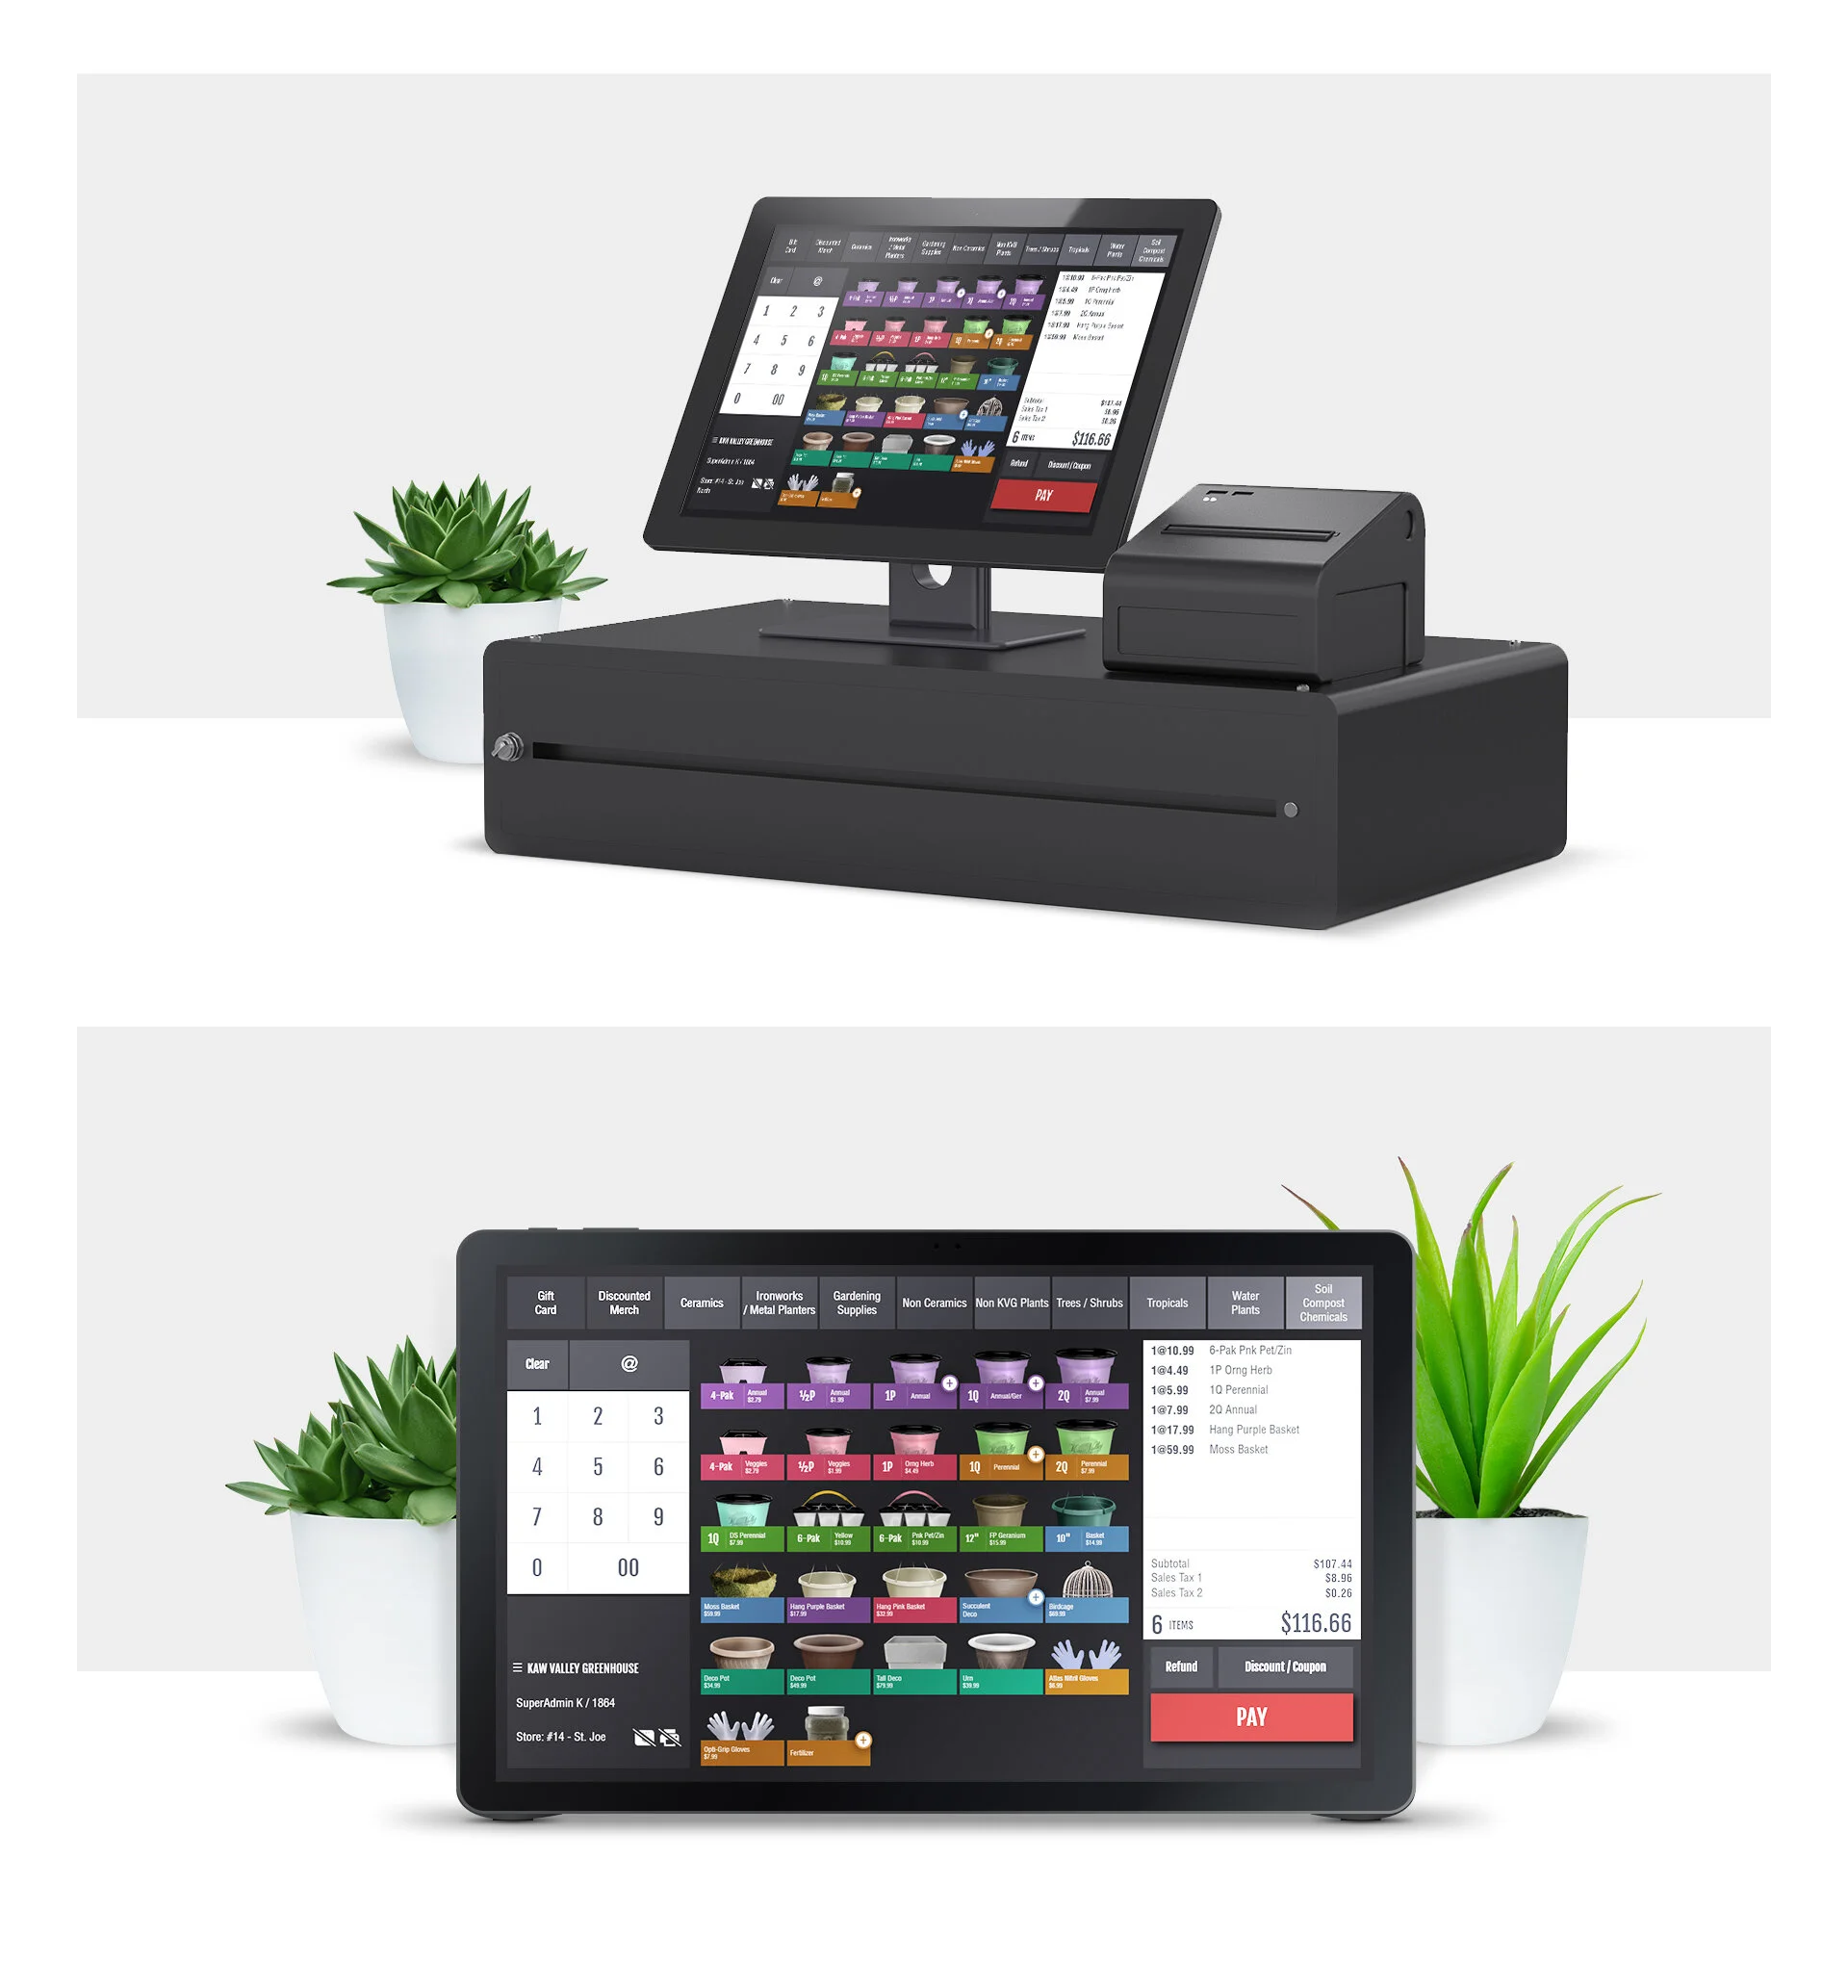
Project: POS redesign — tablet-based point-of-sale and training interface for seasonal pop-up greenhouses across the Midwest
Role: Senior UX Designer — led research, interaction design, prototyping, usability testing, and handoff
Timeline: 6–8 weeks (research → prototype → pilot → roll‑out)
Team: Product Owner, Ops Lead, Store Managers, Front-end Dev, QA
Context Kaw Valley Greenhouses operates seasonal pop-up greenhouses throughout the Midwest. Each season they hire many temporary employees; the legacy POS required memorizing numeric codes and manual steps, creating long checkout times, training friction, and errors that cost the business time and money.
Problem
Slow checkout and high error rates from legacy code-driven POS.
Long onboarding curve for seasonal hires increased labor overhead and checkout staffing needs.
Lost sales and customer frustration during peak periods due to slow register throughput.
Manual reporting and reconciliation work for store managers.
Goals & success metrics
Reduce average checkout time by 40–60%
Cut training time for new hires by 70%+
Reduce transaction errors and voids by 50%+
Increase throughput during peak windows and reduce labor hours required
Deliver production-ready tablet UI and training flow
My approach
Stakeholder alignment
Workshops with Ops, Store Managers, and seasonal leads to quantify pain, peak traffic patterns, and essential transactions.
Field research
On-site observations across 6 pop-up locations during peak operating hours.
Contextual interviews with cashiers, managers, and seasonal hires about tasks, error causes, and training experiences.
Time-and-motion baseline: measured average transaction time, error rates, and training duration.
Synthesis & personas
Created 3 personas: Seasonal Cashier (first-time hire), Experienced Manager, Peak-Time Customer — mapped goals and failure modes.
Interaction design & prototyping
Designed image-first, tap-based tablet POS optimized for quick visual selection, common combos, and one-tap discounts.
Built quick-access hotkeys for manager functions and an undo/void flow to minimize friction.
Included inline prompts and a guided first-run training mode.
Usability testing & pilot
Moderated usability tests with seasonal hires and managers; iterated based on completion time and error metrics.
Piloted in 3 locations over 4 weeks; captured transaction times, error rates, and training time.
Rollout & handoff
Delivered design specs, admin controls, training materials, analytics events, and dev tickets; supported roll-out and onboarding.
Research & key findings
Baseline metrics: average checkout 60–90 seconds; training 8–10 hours to reach competency; frequent code-entry errors and mis-rings.
Pain points: numeric-code lookup, buried void/edit flows, slow product lookup during peak lines.
Opportunity: visual recognition is faster for seasonal hires; contextual guidance reduces ramp time and errors.
Design solutions
Image-driven product grid with category tabs and large touch targets for tablet checkout.
Favorites and “Today’s Top Sellers” row to speed common purchases.
Bundles and quick-combo buttons for frequent item groups (pots + plant + soil).
Simple discount and tax buttons; clear undo/void with manager confirmation.
First-run guided onboarding: 10–15 minute interactive walkthrough replacing long classroom training.
Manager dashboard: daily sales summary, void/discount logs, and simple reconciliation exports.
Measured outcomes (pilot → roll-out)
Average checkout time: reduced by 50% (from ~75s to ~37s average).
Training time to competency: reduced by ~75% (from 8–10 hours to ~2 hours of guided onboarding).
Transaction errors and voids: reduced by ~60%.
Peak throughput: lines moved 35–50% faster, reducing customer wait and lost sales.
Labor hours: reduced cashier staffing requirements during peak times, contributing to operational savings.
Financial impact: resulted in millions of dollars in annual savings company-wide from reduced labor costs, fewer lost sales, and lower reconciliation overhead.
Deliverables
High-fidelity tablet prototypes (Figma)
Time-and-motion baseline report and pilot metrics dashboard
Interactive onboarding flow and training materials
POS UI spec, component library, and accessibility notes
Analytics event map for transaction time, errors, and training completion
Handoff package: dev tickets, acceptance criteria, and rollout plan
Learnings & impact
Visual, image-first interfaces dramatically reduce cognitive load for seasonal staff and speed selection.
Embedding a short guided onboarding in the product eliminates lengthy classroom training and accelerates time-to-value.
Small UX improvements (bundles, favorite rows, undo flows) compound into substantial operational and financial gains at scale.
Measuring baseline metrics onsite is essential to quantify ROI and prioritize high-impact changes.